From time to time one needs to check server status over different periods of time. Unfortunately, various console utilities are not able to provide this information since they can track server performance in real time only. In such cases we need to apply a special server monitoring system which can track and save server performance results over a long time frame. Today you can find plenty of such systems which are compatible with various types and number of servers and server configurations: Nagios, Zabbix, Monitorix, Linux-Dash.
In this article we are going to talk about Monitorix and how to use it on Ubuntu. This system is pretty good for monitoring one server (although it can also communicate with other servers that have Monitorix installed) and it does not consume too much system resources.
To install Monitorix one first needs to add a new repository:
sudo echo “deb http://apt.izzysoft.de/ubuntu generic universe” >> /etc/apt/sources.list
Next, install the repository key:
wget http://apt.izzysoft.de/izzysoft.asc
sudo apt-key add izzysoft.asc
Update repositories:
sudo apt upgrade
Finally, we can install Monitorix:
sudo apt install monitorix
It will be available under the following address: http://localhost:8080/monitorix.
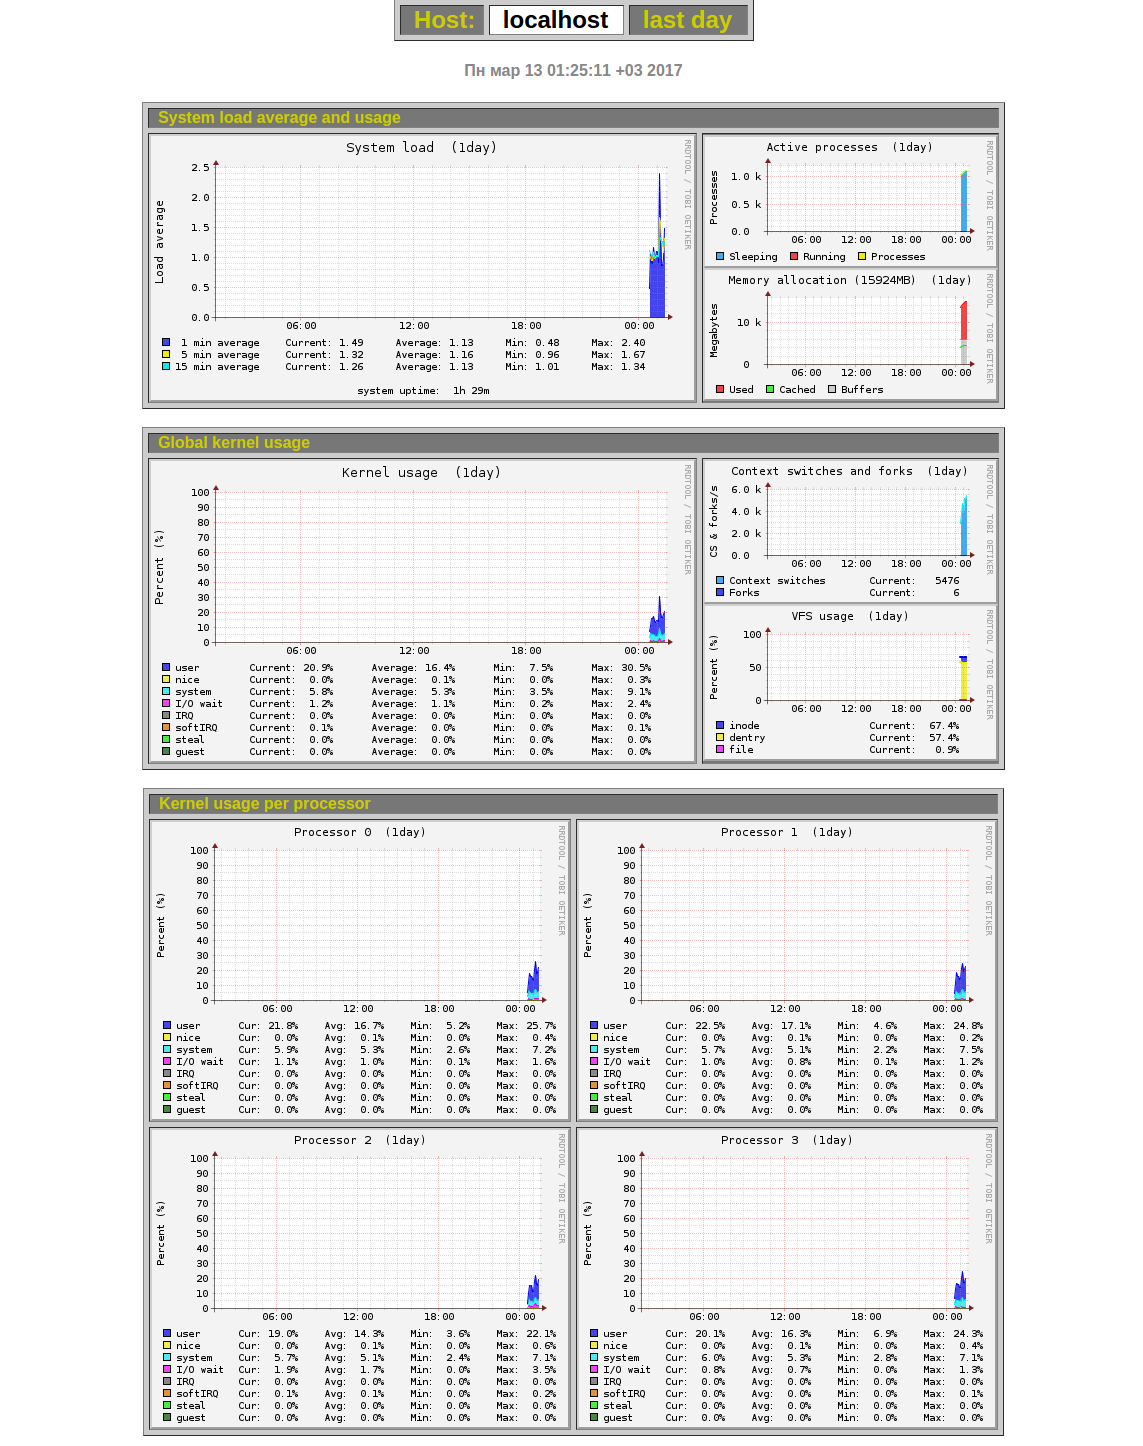
This is how the monitoring system interface looks like:
The default configuration displays plenty of various graphs, but this view is customizable so you can always add new graphs or hide any of them. For that open the /etc/monitorix/monitorix.conf configuration file or create a new one with the .conf extension under the /etc/monitorix/conf.d/ directory and customize the section with the graphs (graph_enable).
For instance, to enable an apache graph you need to change:
apache = n to apache = y
If the graph is not correctly displayed check the <apache> section and the list value. It should contain the path to server-status and apache should have the server-status configuration included as well. You can also change the interface skin color by editing the theme_color paremeter (for instance, apply black or white).
To change server port one needs to change the port parameter in the httpd_builtin section from the default (8080) to any other required value.
To enable a password-protected access to the system edit the auth sub-section in httpd_builtin. The default settings are:
|
1 2 3 4 5 |
<auth> enabled = n msg = Monitorix: Restricted access htpasswd = /var/lib/monitorix/htpasswd </auth> |
So, to switch it on you need to change the enabled parameter to “y” and specify the path to the password file in the htpasswd parameter.
To enable MySQL grahp modify the <mysql> section as follows (in case the changes do not apply you need to check for the /etc/monitorix/conf.d/00-debian.conf file and in case the file exists you need to delete the <mysql> section in it):
|
1 2 3 4 5 6 7 8 9 |
<mysql> conn_type = host list = localhost <desc> localhost = 3306, login, password </desc> rigid = 0, 2, 0, 0, 0, 0 limit = 100, 100, 100, 100, 100, 100 </mysql> |
conn_type – connection type. One can create a socket connection by defining conn_type as socket while list should indicate the host or the path to the socket.
The <desc> parameters should be defined by following this pattern:
<host> = <port>, <login>, <password>
If connection is not password-protected you may leave the password space empty:
localhost = 3306, login,
Once the configuration is ready you need to restart Monitorix with the daemon command:
sudo service monitorix restart
For more details about the Monitorix system please check the official manual: http://www.monitorix.org/documentation.html


